Decoding gene regulation in the fly brain
Accompanying resource for the paper by Janssens, Aibar, Taskiran et al. (2021)
An interactive platform to explore the fly brain single cell datasets:
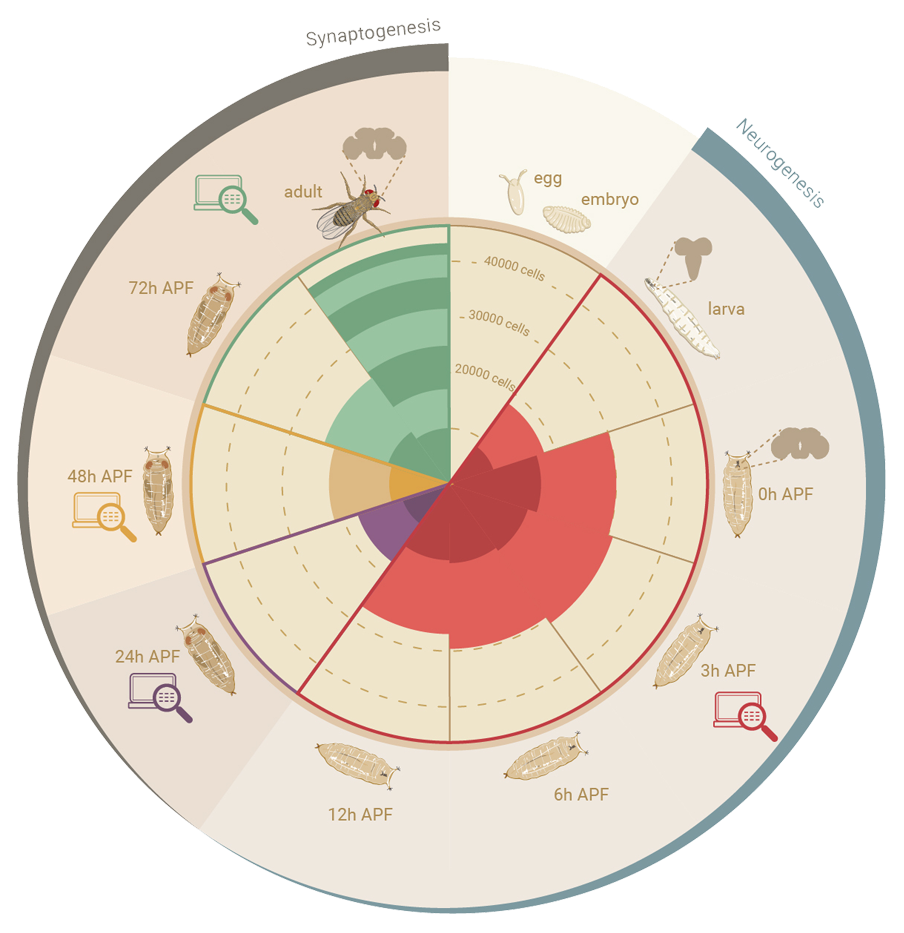
In this site:
Cell type information
Cell-type specific enhancer Gene Regulatory Networks (eGRNs).
Enhancer architecture
External resources:
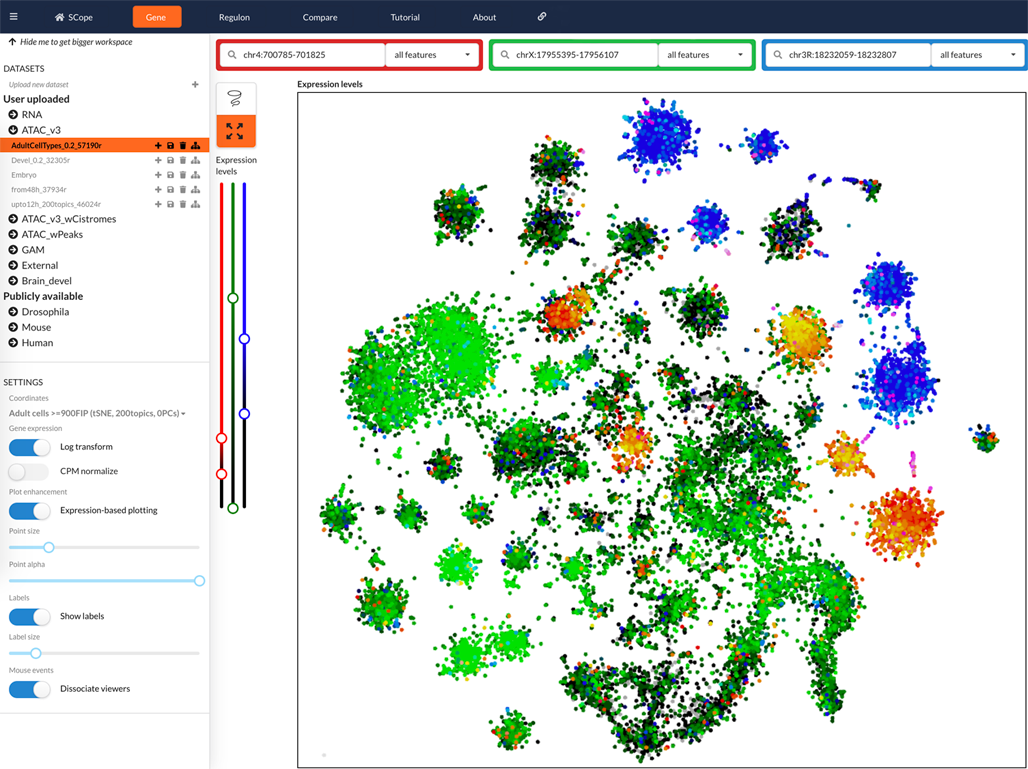
 Scope
Scope
URL: http://scope.aertslab.org/#/Fly_Brain
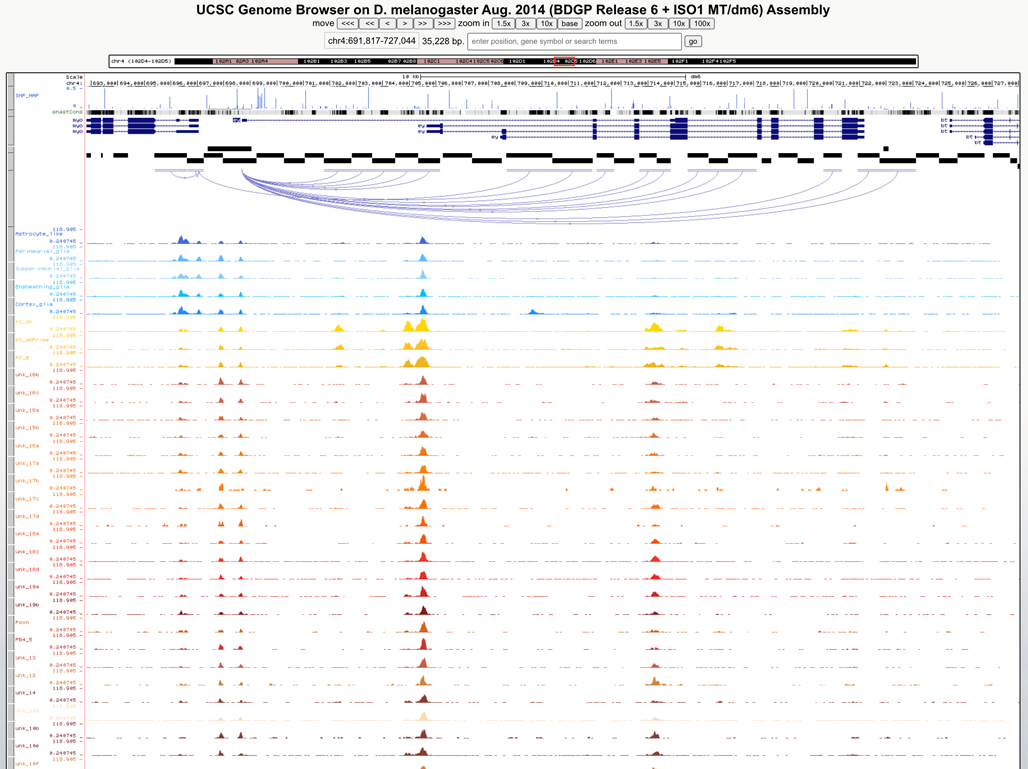
 Genome browser
URL: http://ucsctracks.aertslab.org/papers/FlyBrain/hub.txt
Regulatory networks (eGRNs) for selected adult fly brain cell types
Motif enrichment based:
KC-AB 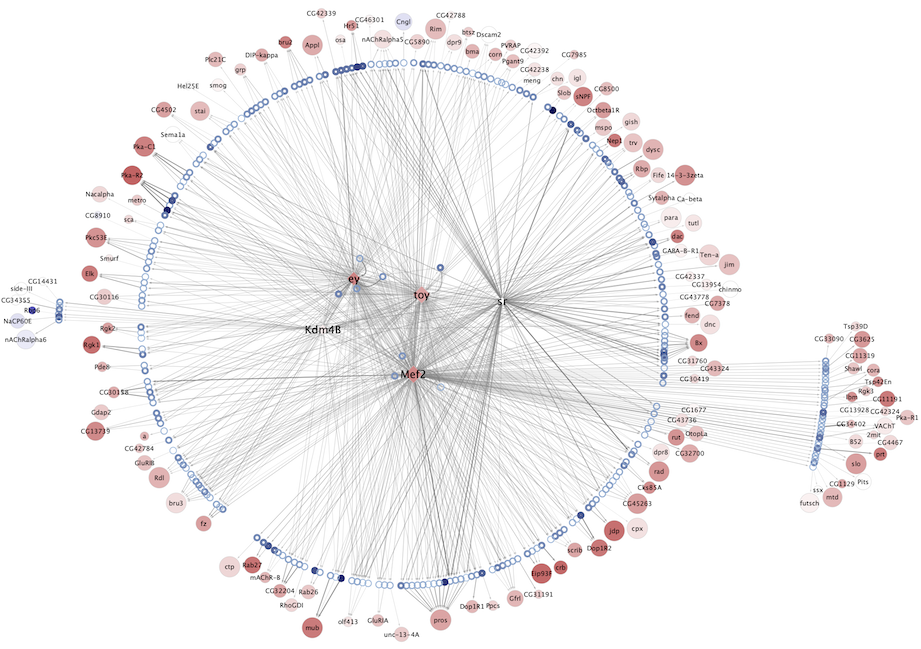 |
KC-ABprime 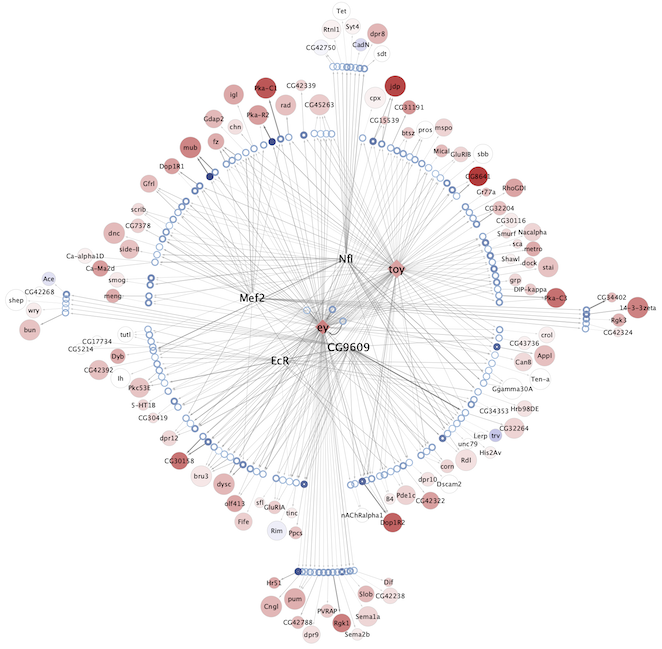 |
KC-G 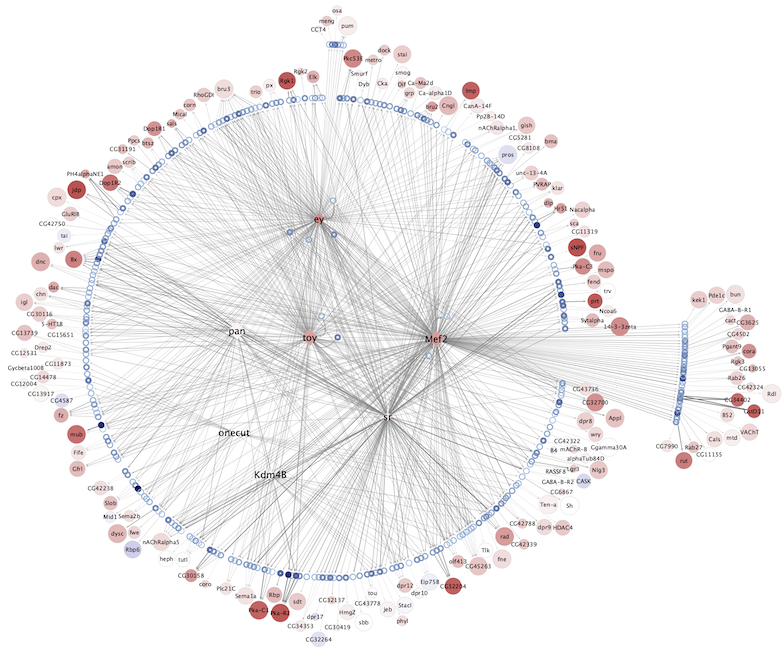 |
|||
T1 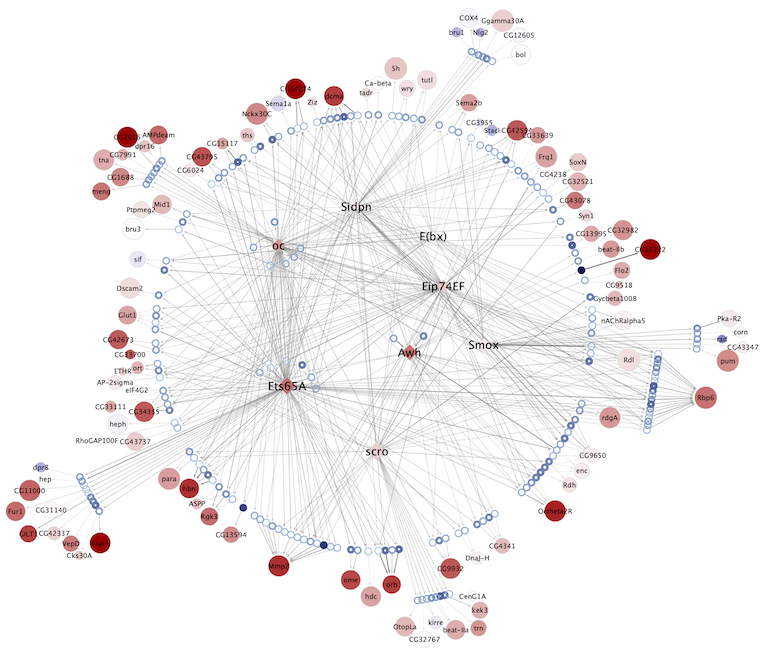 |
T2 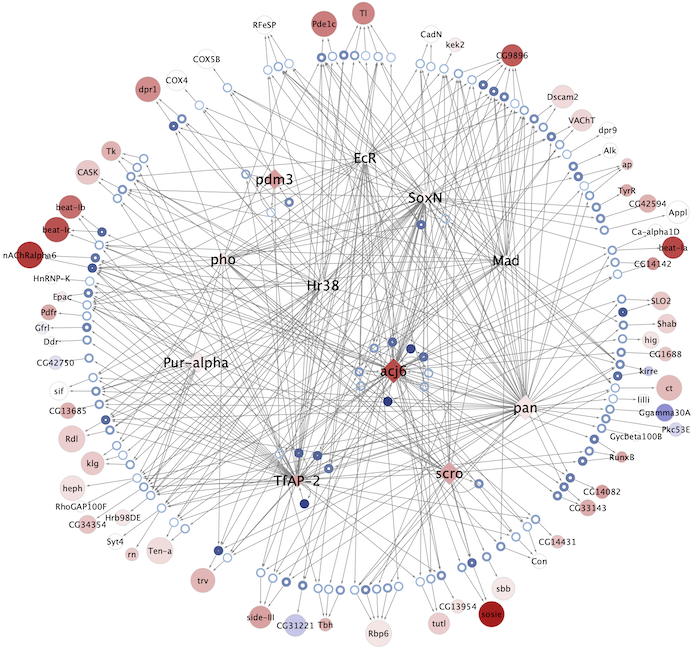 |
T2a 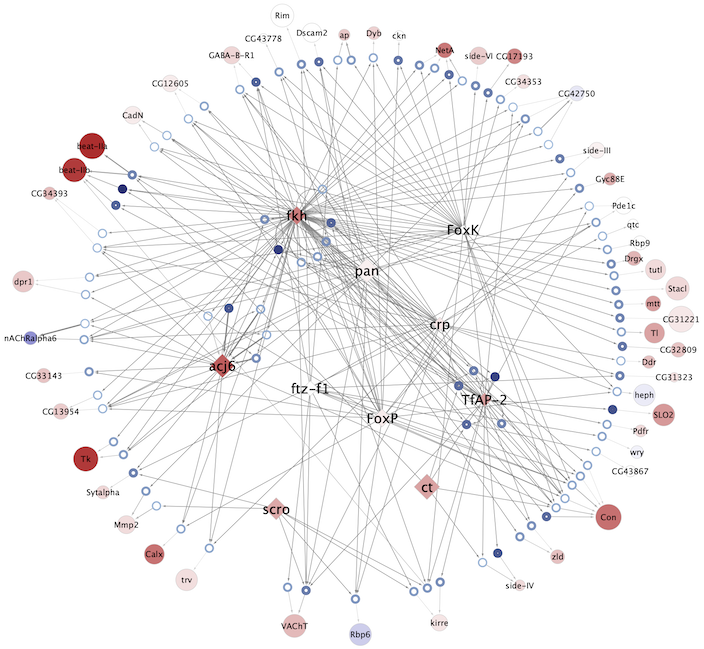 |
T3 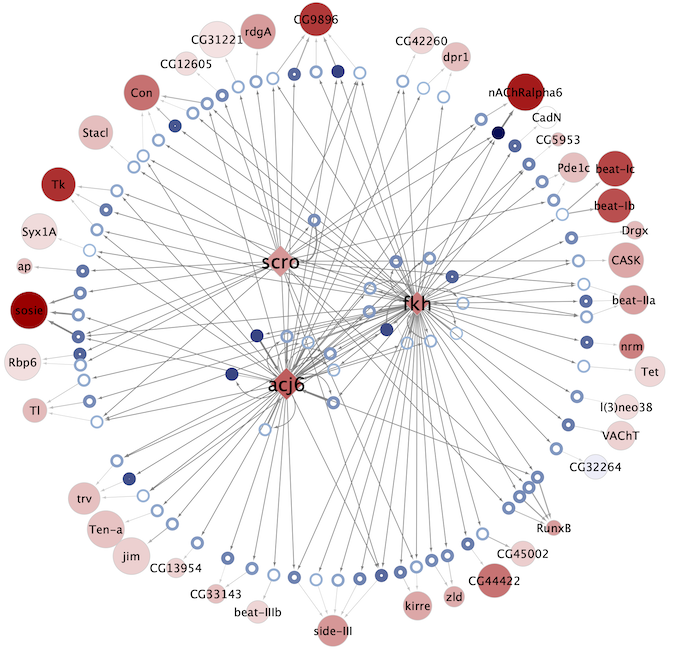 |
T4 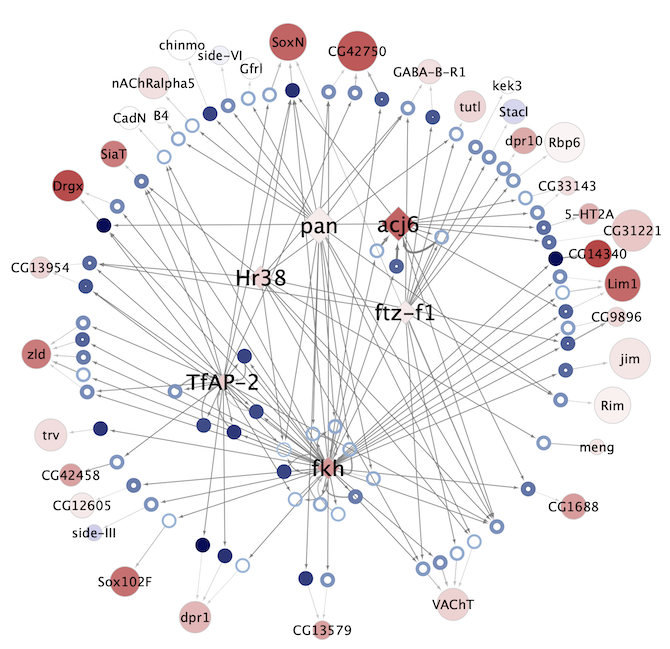 |
T5 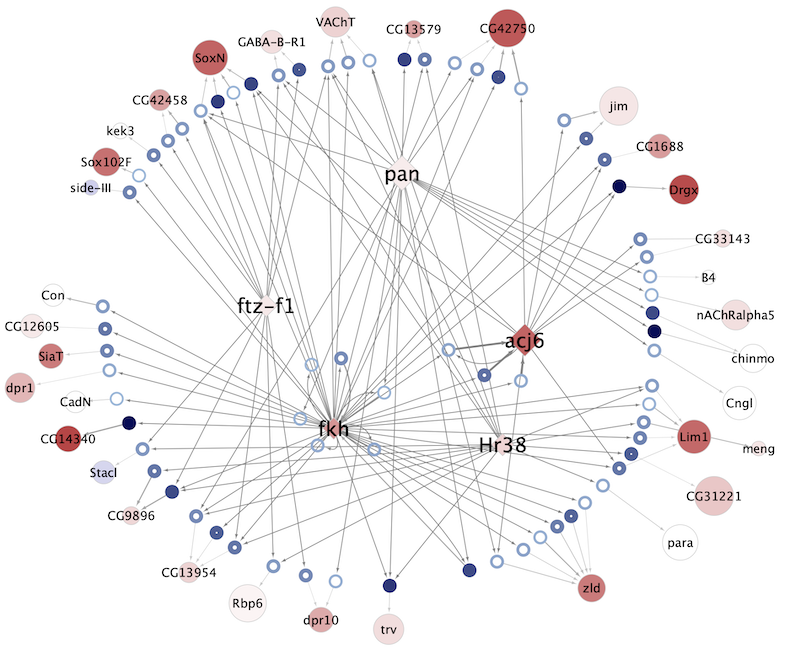 |
Astrocyte-like glia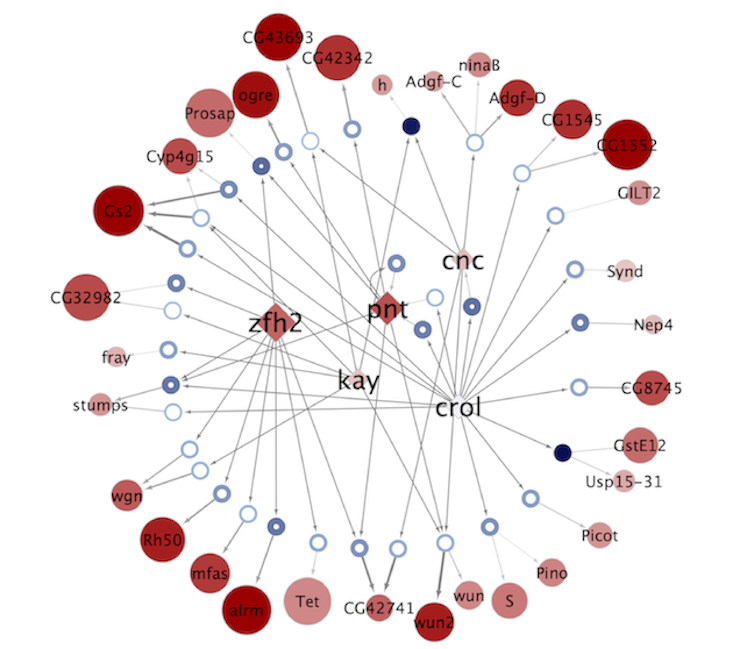 |
Perineurial glia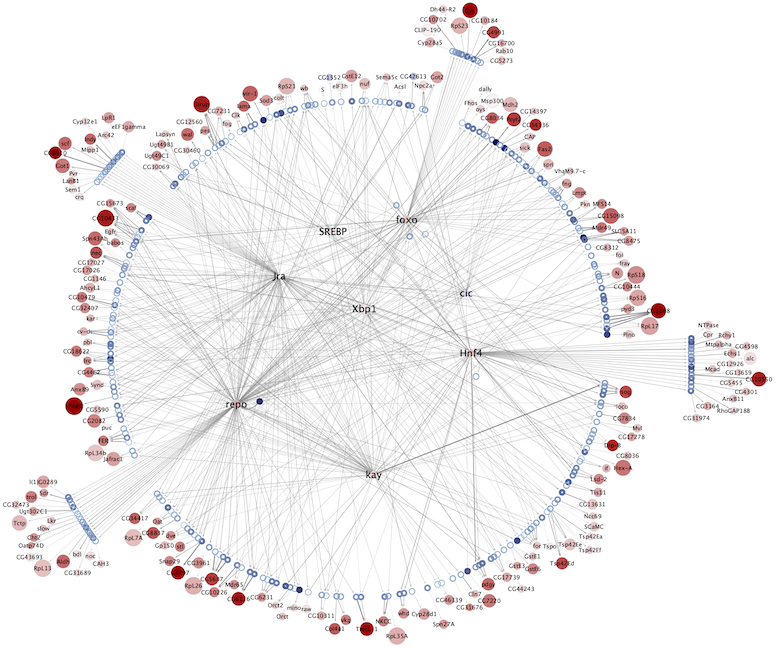 |
Subperineurial glia |
Cortex glia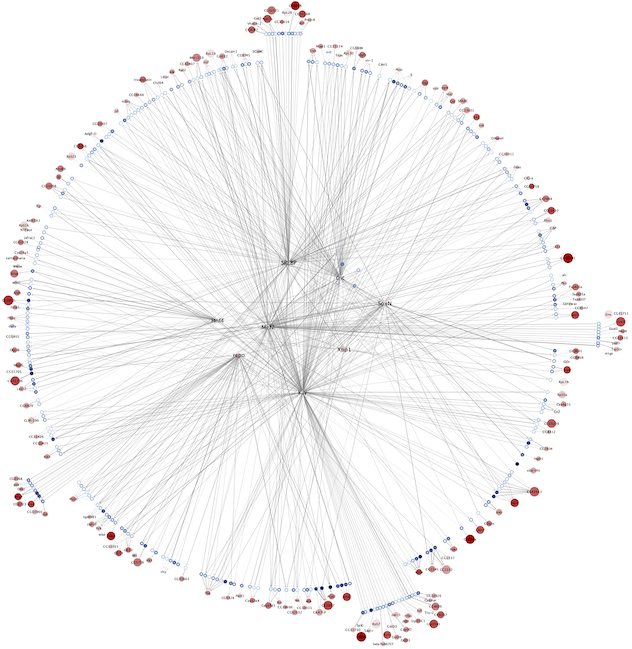 |
Ensheathing glia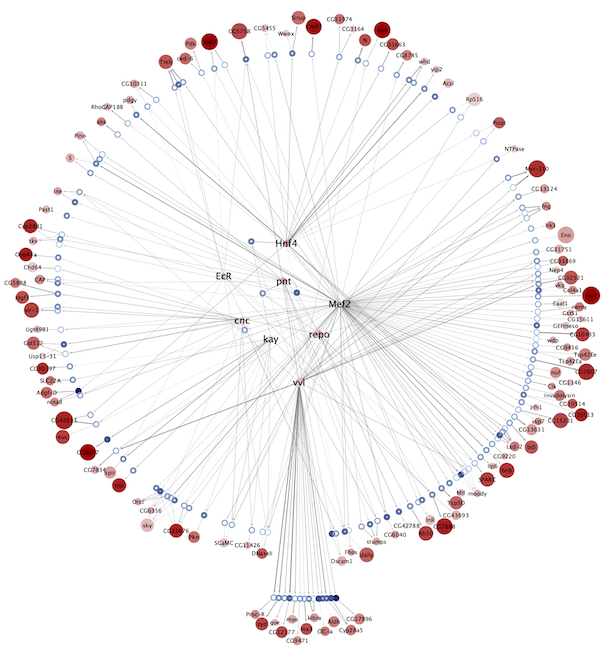 |
Chiasm glia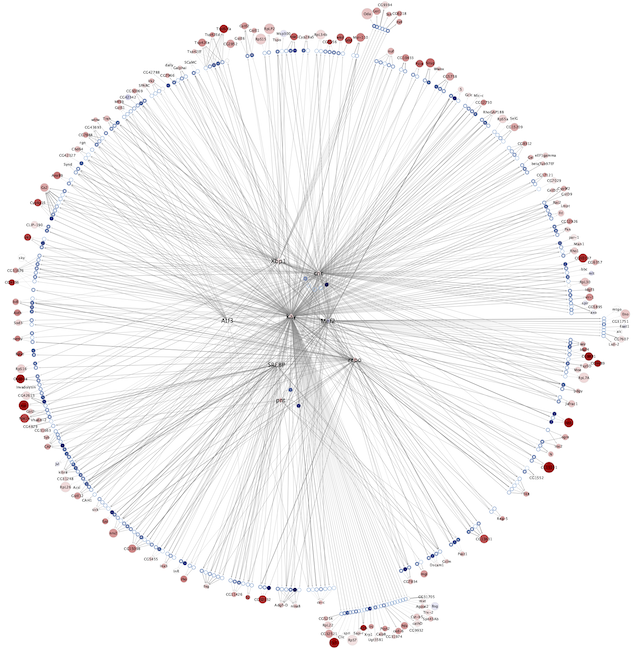 |
[+] Legend & explanation
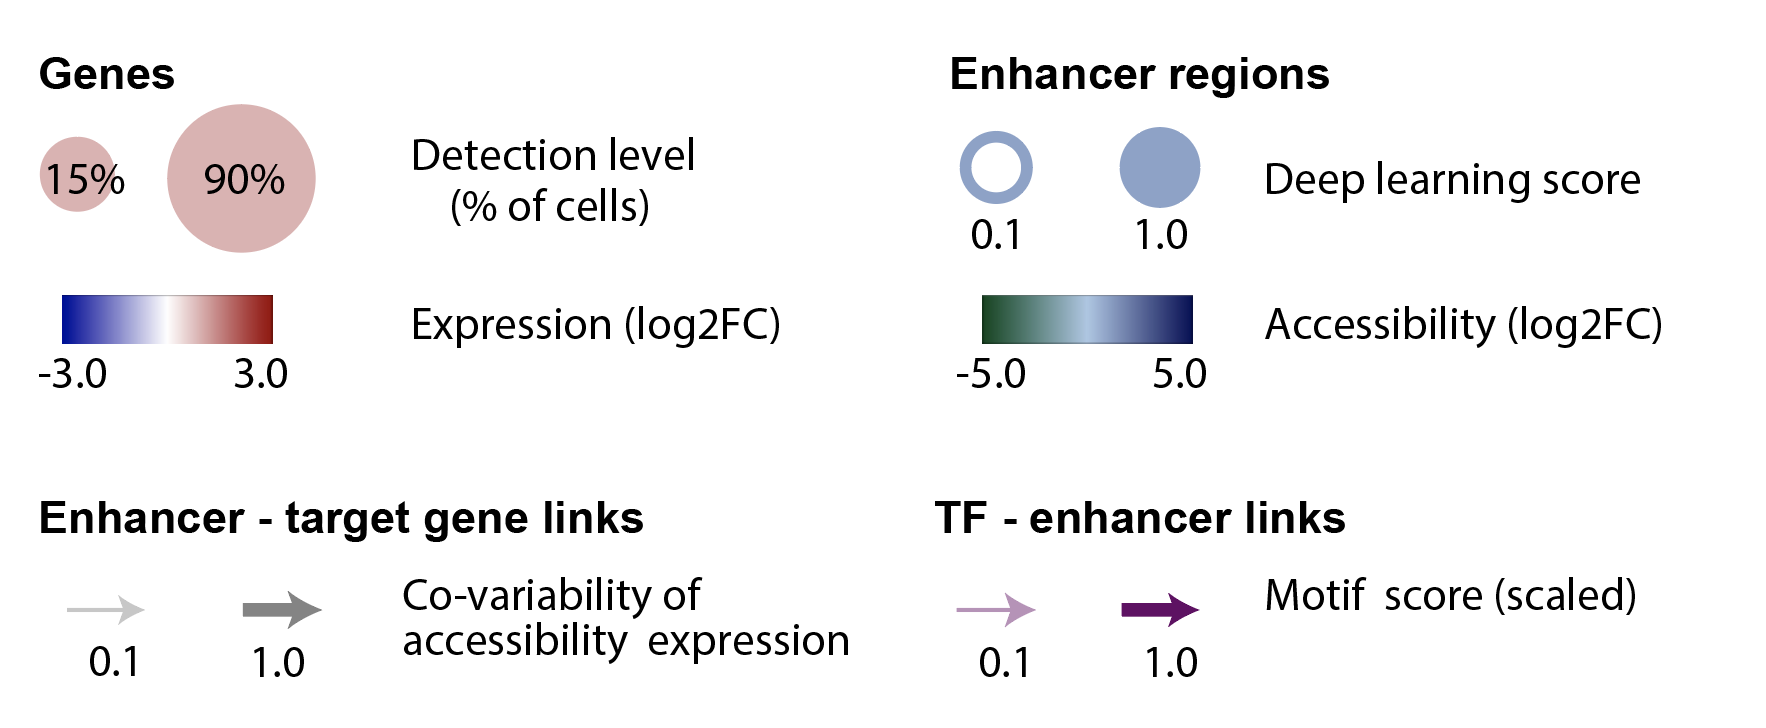
The eGRNs were built based on consistent TF expression and motif enrichment on cell-type specific regions (see the paper for details).
The data behind these eGRNs (and the remaining cell types, which are not plotted) can be explored in the section “Network tables” and is also available for download.
Updated (version): Aug. 2021
Deep Learning based: (Only available for kenyon cells)
KC-AB 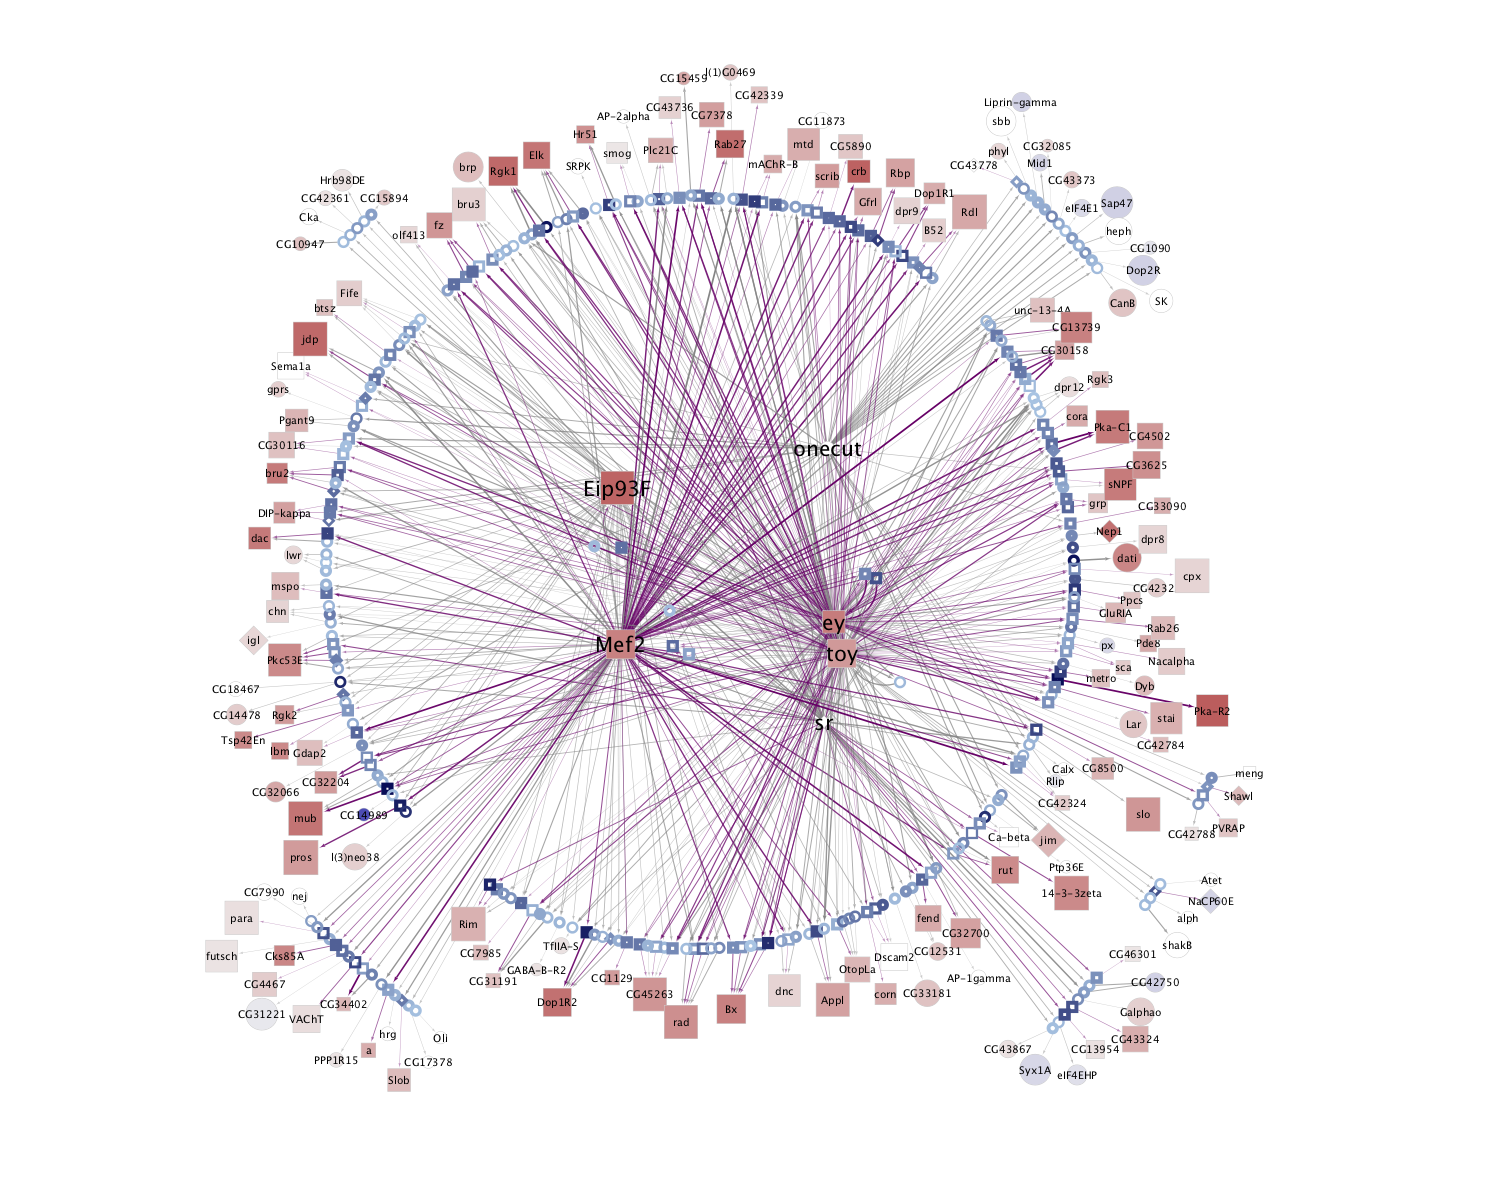 |
KC-ABprime  |
KC-G 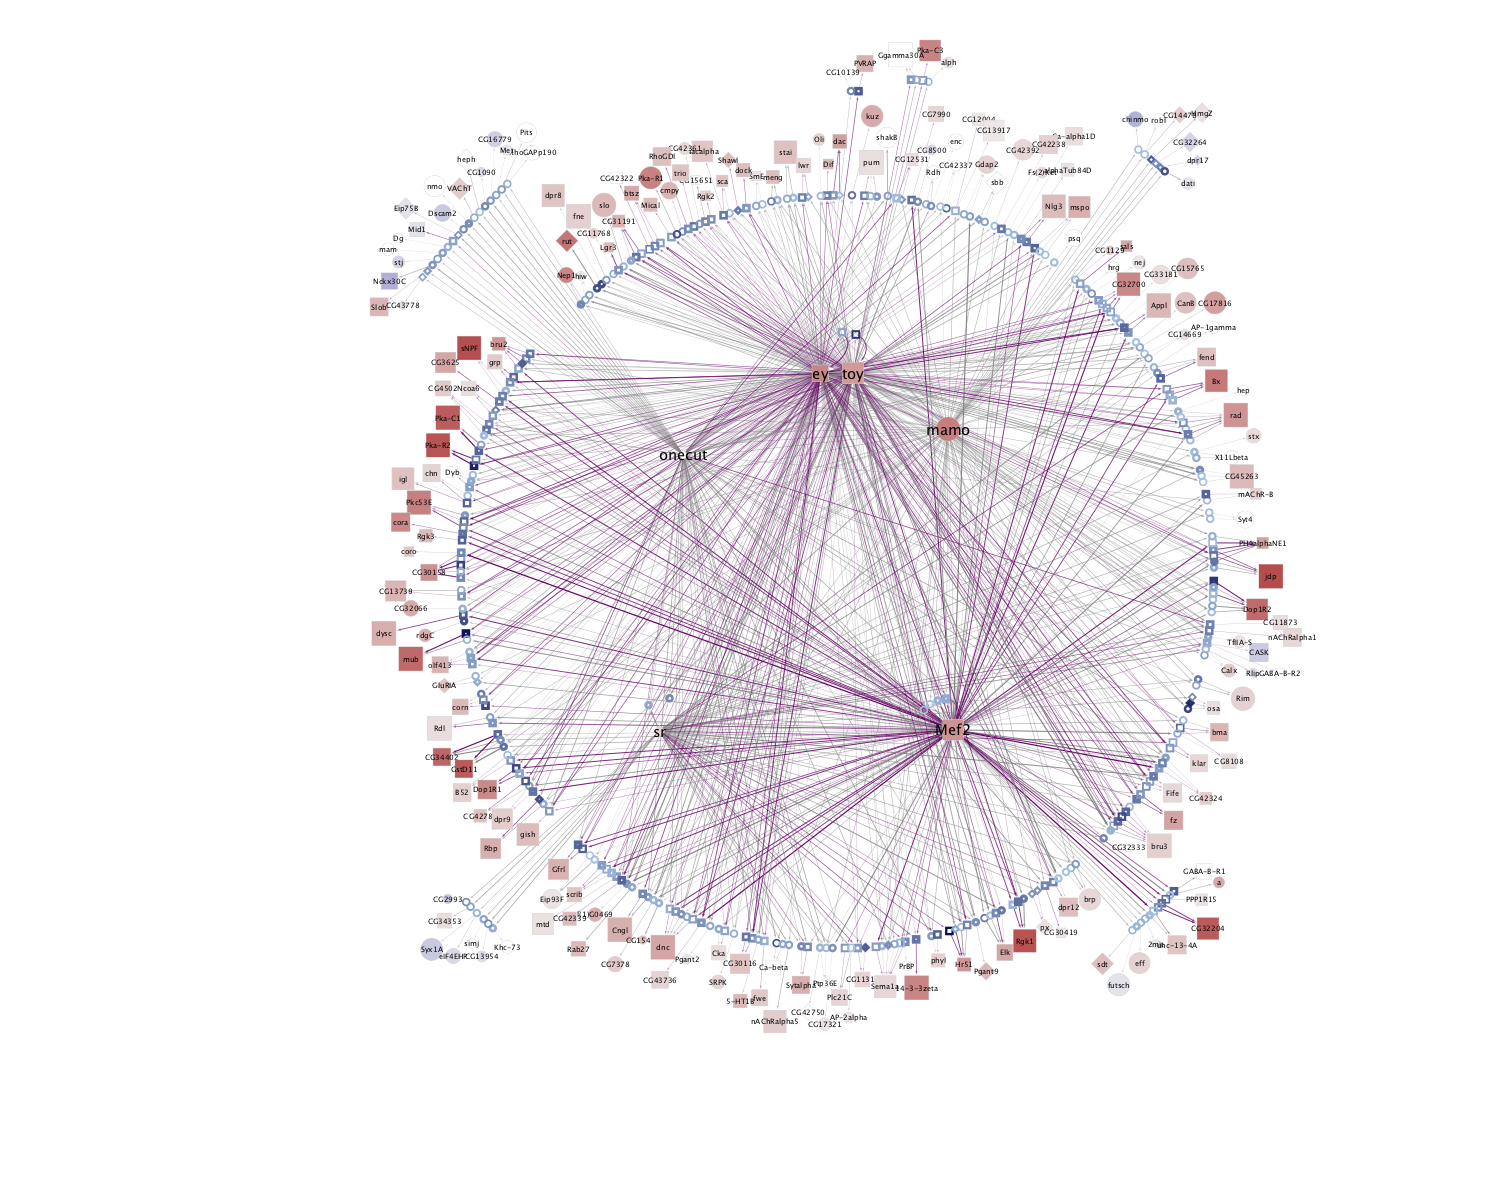 |
 |
 |
 |
 |
 |
 |
Combined network of Motif-enrichment- and DL-based networks:
KC-AB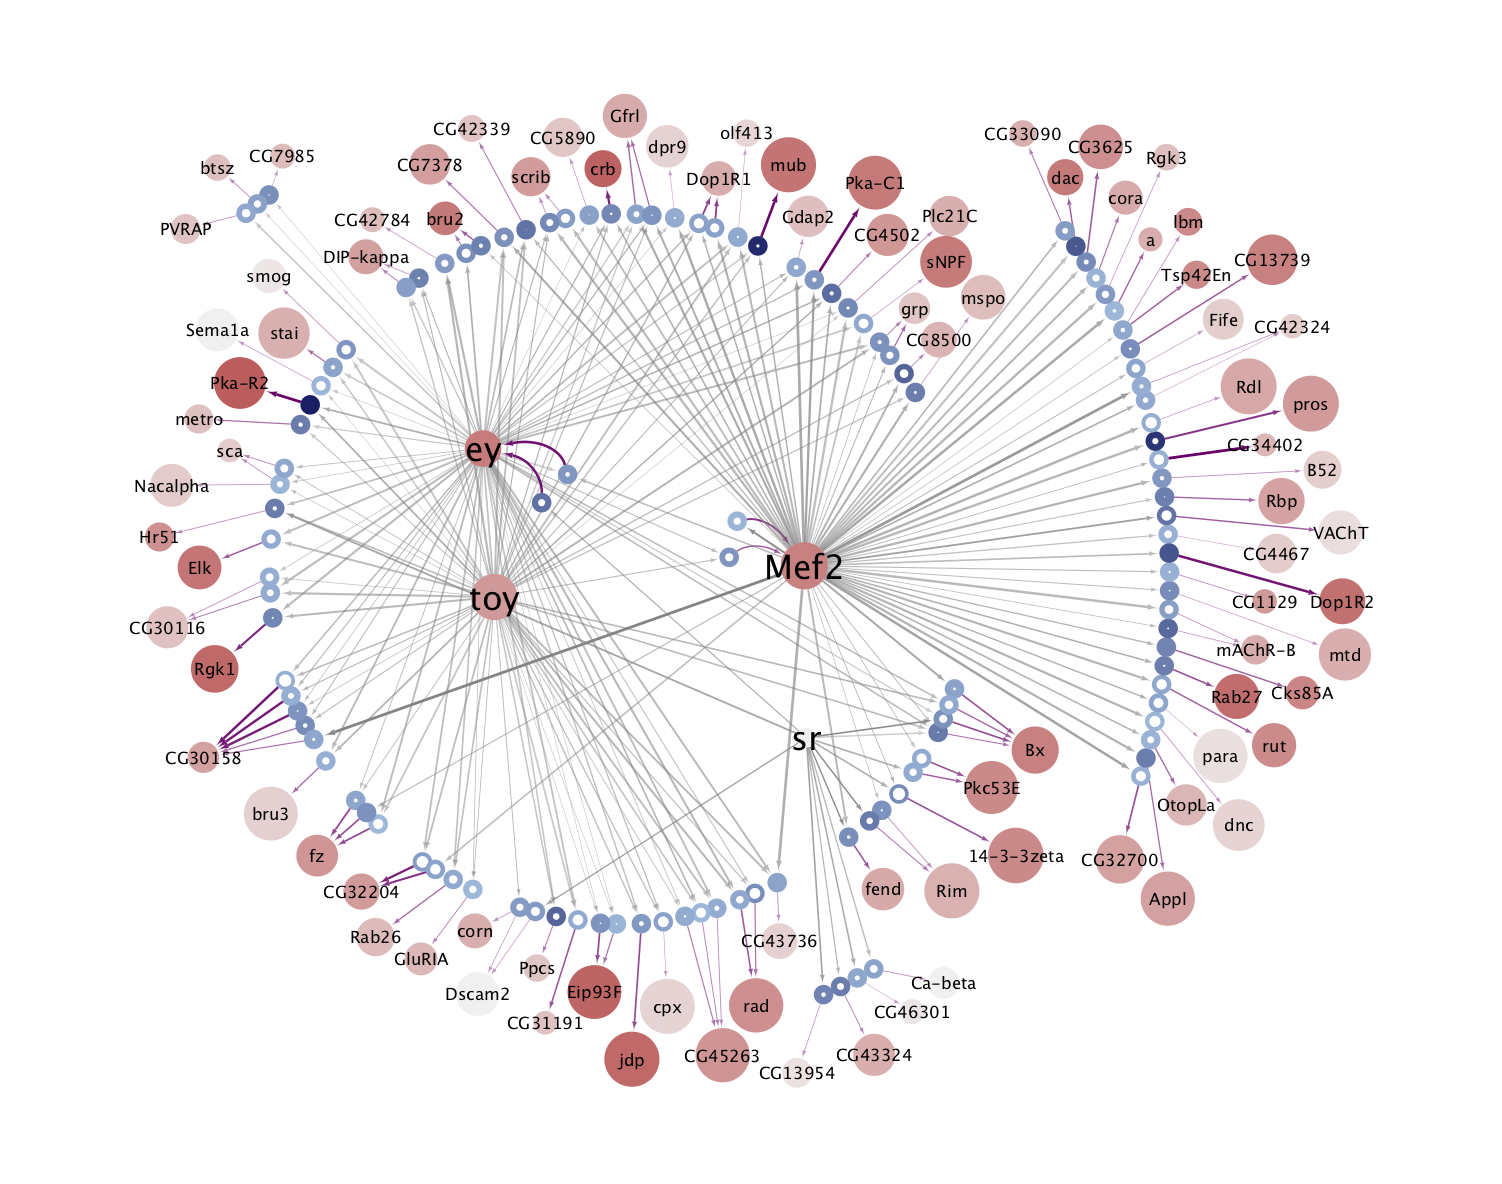 |
KC-ABprime 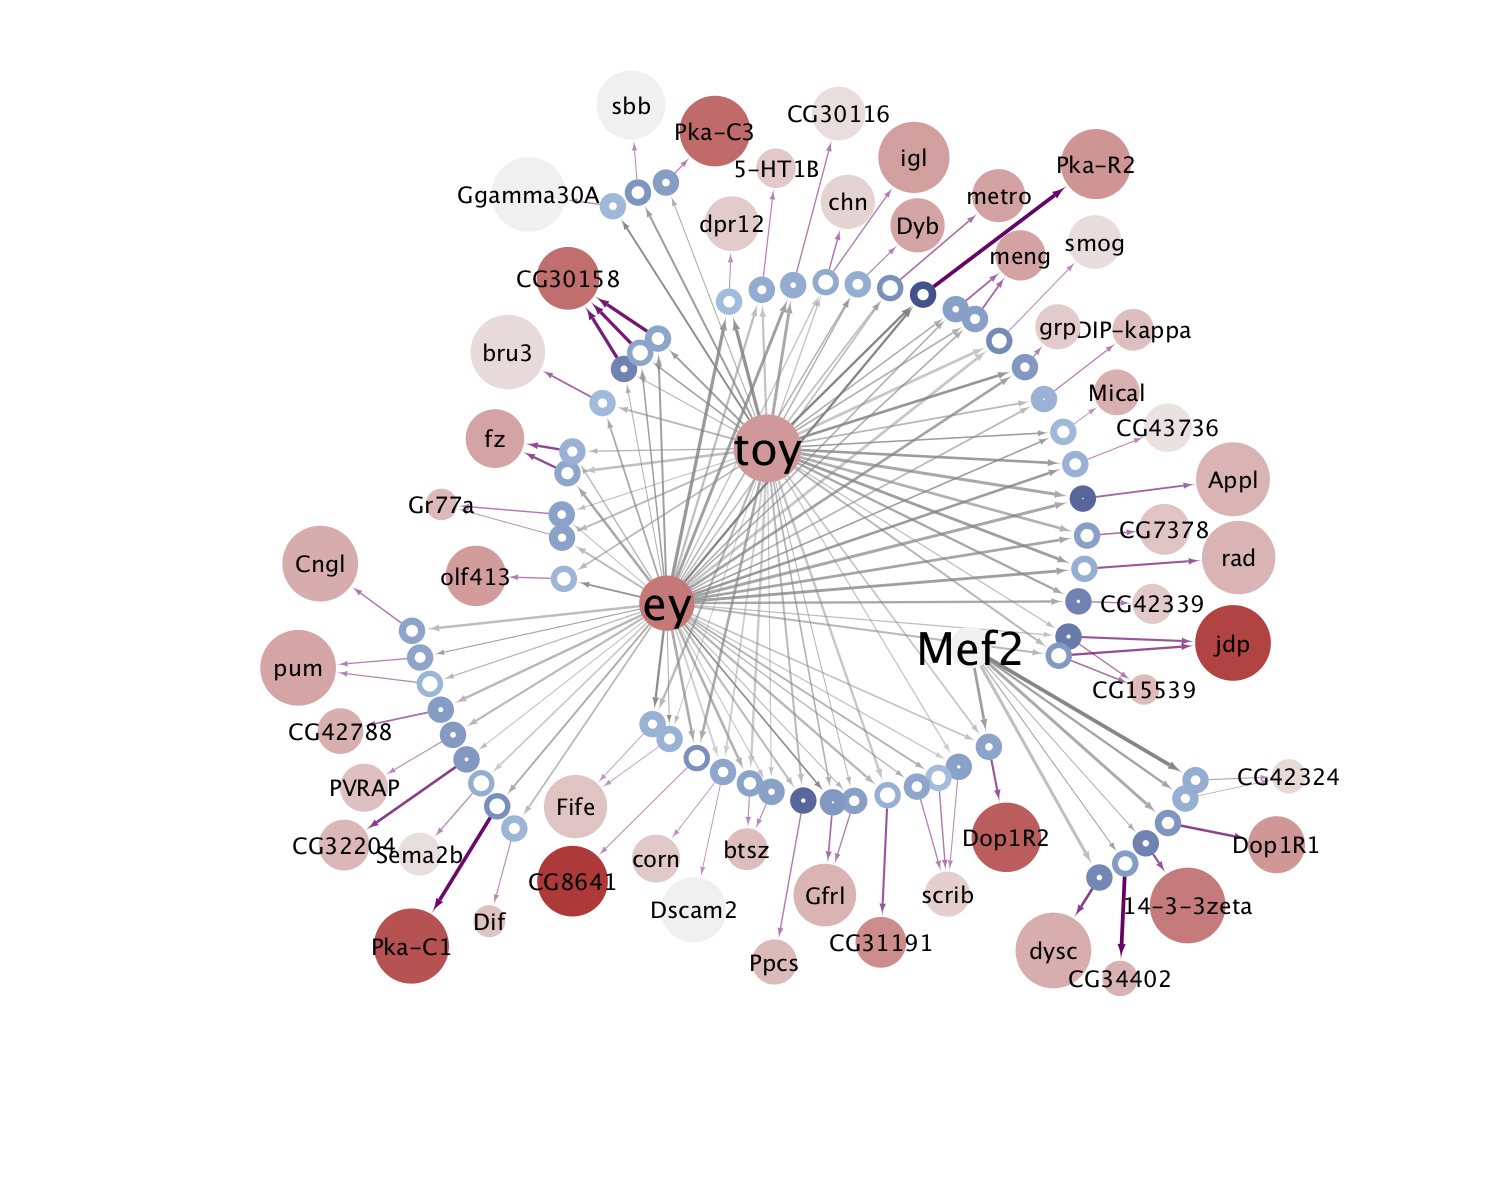 |
KC-G  |
 |
 |
 |
 |
 |
 |
TFs consistently enriched in each cell type
[+] Description & legend
Expressed Transcription Factors (TFs) with motif enrichment on the differentially accessible regions for each cell type.
Legend:
Dot size: The size of each dot in these dotplots represents the TF motifs' enrichment in the DARs of the cell type.Color: Average expression. For each TF the maximum value is converted to 1. Red color indicates high expression. For “Open chrom.”, the color scale starts from grey (low expression). For “Close chrom.”, the color scale starts from blue (low expression), and also scales to red (high expression).
Settings:
The
TF enrichmentselector allows to choose between different settings:Open chrom.: TFs with positive correlation of expression and motif accessibility (e.g. likely chromatin openers).Close chrom.: TFs with negative correlation (Candidate represors). Note that the candidate repressors are not filtered based on TF expression, and therefore are more likely to include a higher rate of wrong annotations (e.g. annotated to alternative TFs from the same family).TF orderto order the TFs in the heatmap.TFs with an
astheriskhave an absolute TF motif-expression correlation between 0.20 and 0.40 (but still above 0.20, which is the minimum value to be included in the heatmap).
Notes:
T4/T5 are not distinguishable in the scRNA-seq dataset, so the same RNA-cluster has been taken for the TF-expression for both cell types.
The central brain clusters are merged into two broad categories: CB-pros and CB-imp.
Implementation details:
The cistromes in the heatmap require a minimum TF motif-expression correlation of 0.20, at least 10 target regions, and the TF needs to have at least an eGRN of positive links (e.g. in one cell type).
TF expression filter: – The “Opening” cistromes require the TF to be expressed in the given cell type, otherwise it is not considered. – For “Closing” cistromes, the TF needs to be expressed in at least one cell type (even if it is not the same with motif enrichment). For “Closing cistromes”, it is also required to have at least a motif with NES > 5.
Updated (version): Aug. 2021
TFs in scATAC- and scRNA-seq datasets
[+]Description
Explore the details for the TFs from the previous dot-heatmap: TF motif enrichment in the DARs of the scATAC dataset and their expression in the scRNA dataset.
- The cistromes are all “opening cistromes” (i.e. motifs with high confidence annotations and correlated with the TF expression; motifs enriched in DARs for cell types without TF expression are ignored).
[+] Legend: Cell types in t-SNE
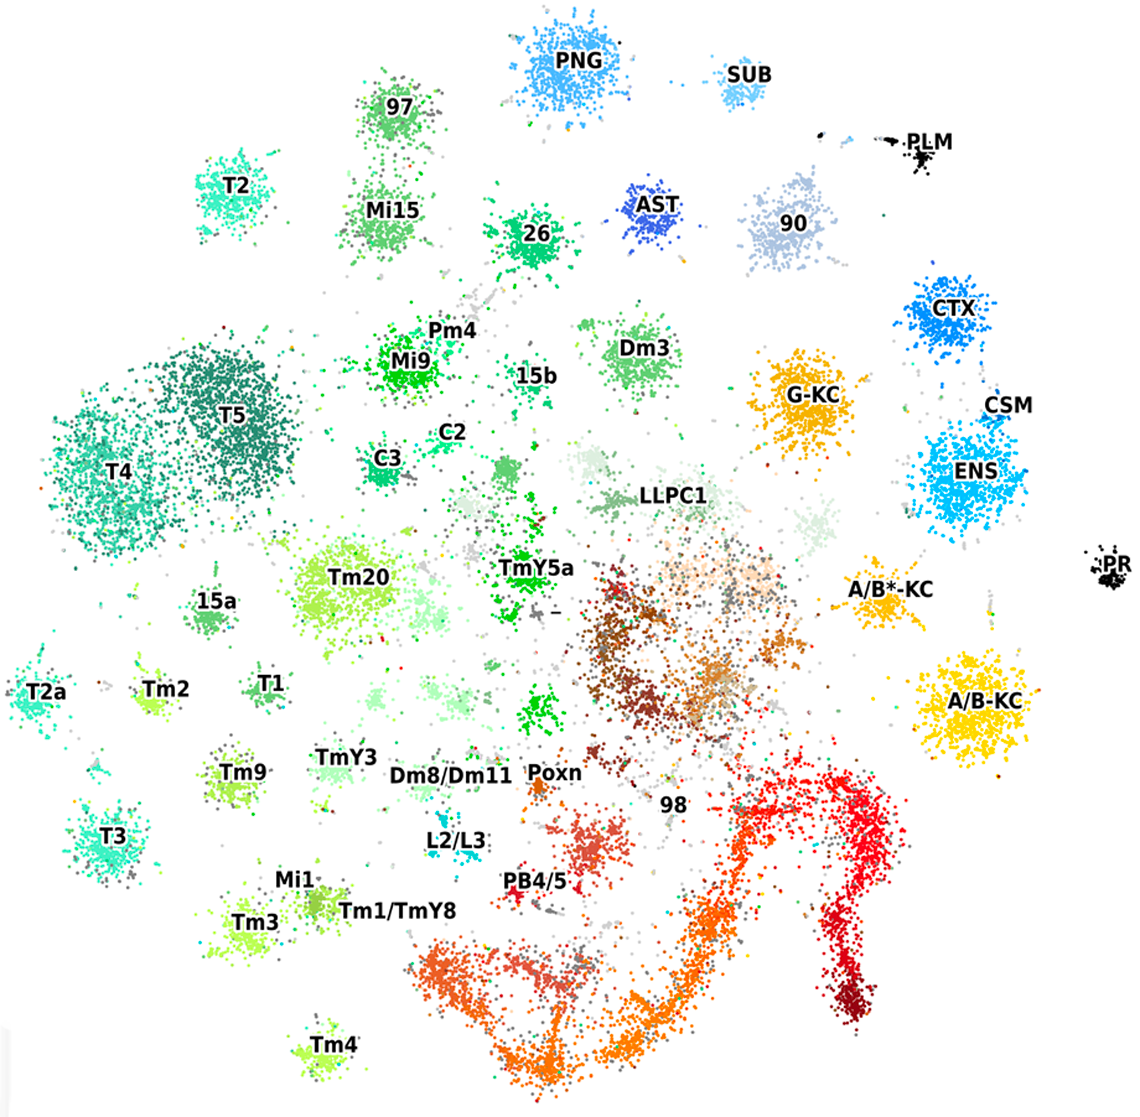
Cell type abbreviations:
- Astrocyte-like glia (AST), Chiasm glia (CSM), Cortex glia (CTX), Ensheathing glia (ENG), Perineurial glia (PNG), Sub-perineurial glia (SUB), Centrifugal neurons (C), Transmedullary neurons (Tm), Lamina monopolar neuron (L), Poxn-neurons of the ellipsoid body (PXN), Protocerebral bridge neurons (PB), Photoreceptors (PR), Plasmatocytes (PLM), Kenyon Cells (KC). Numbers are cell clusters that match between scRNA- and scATAC-seq but have not been annotated to a specific neuron type.
Updated (version): Aug. 2021
We are working on improving the speed of this page. Thank you for your patience.
TF expression vs Motif enrichment
TF motif enrichment (per cell type/group)
TF expression (per cell type/group)
Cistrome accessibility
Cistrome accessibility (per cluster)
Cell types
Motifs for this TF
Overlap of cistrome regions
[+] Description
The following heatmap can be used to compare the regions that are included in a cistrome.
By cell type: Allows to visualize TFs that might be regulating the same/different regions in the given cell type.
By TF: To compare common/differential TF targets deppending on the cell type.
Gene regulatory networks for adult cell types
The Networks tab allows to query the eGRNs (TF-region-gene) for all the available adult cell types.
The remaining tabs allow to explore the data behind the eGRNs:
DARs: Differentially accessible regions for each cell type
Motif enrichment (on DARs, Topics and cell-type peaks)
Transcription factors per cell type
Regions per motif
Region-gene link
RNA markers
Query by region: Search for a given region and obtain summary of all the information available.
How to connect the tables:

The full tables are also available in the “Downloads” section.
Cistromes and eGRNs for adult cell types
[+] Description
Analysis details:
For each cell type, the cistrome links each TF to all target regions which present enrichment of its binding motif.
To obtain the eGRNs, typical filters include:
- Opening cistromes for expressed TFs:
chromCorr = openChromandtfExpr = true - Positive links to gene expression:
linkDir = posLinks inEregulon = true(i.e. target genes are enriched within the co-expressed with the TF)withinBeaf = true(i.e. The link is within BEAF-32 boundaries)
Only cistromes with least 10 target regions were taken into account for the eGRNs.
Columns:
TF: TF with motif enrichment in the target regionscellType: Cell type whose DARs are checked for motif enrichmenttfExpr: Whether the TF is expressed in the given cell typeregion: Target region (of the TF in the given cell type)chromCorr: Whether the TF expression and the TF motif are positively (open) or negatively correlated (close). <!–# - Open/close (abs corrTM_040 > .40) # - Open/close_ext (signif & .20) # - Unclear–>targetGene: Genes linked to the target region.linkDir: Link direction of the Region-Gene (recommended: use only positive links).inEregulon: Whether the gene is co-expressed with the TF (i.e. in the top of the TF co-expressed genes, based on GSEA)withinBeaf: Whether the region is within BEAF-32 boundaries around the gene (i.e. discards region-gene links that are too far away)
Network version: 1.0 (Aug. 2021)
Differentially accessible regions for adult cell types
[+] Description
Analysis details:
- Under contruction
Columns:
- Under contruction
Network version: 1.0 (Aug. 2021); Table last updated on 12 Jun 2020.
TF motif enrichment
[+] Description
Analysis details:
- Under contruction
Columns:
- Under contruction
Network version: 1.0 (Aug. 2021; Table last updated on ____.
TFs per cell type
[+] Description
Analysis details:
- Under contruction
Columns:
- Under contruction
Network version: 1.0 (Aug. 2021)
Regions with enrichment of each motif
[+] Description
Analysis details:
- Under contruction
Columns:
- Under contruction
Network version: 1.0 (Aug. 2021)
Region - gene links
[+] Description
Analysis details:
The enhancer-to-gene links indicate co-accessibility of the region with the gene’s expression across the 45 matched cell types/clusters.
Search space: Regions within 50kbp of the gene's longest transcript (50kbp upstream the TSS and 50kpb downstream the end, plus the introns).
We recommend focusing only on the positive links (see Additional Data Fig. XX in the paper).
Columns:
Regulatory region: Location of the linked regulatory regionMaxAcc: Maximum accessibility of the regionGene: Gene nameTSS: Location of the most upstream TSS (only used for defining the search space and plotting)strand: Strand in which the gene is locatedLinkScore:rankScore <- accRank + corrRank + genie3rankBinQrescaled to 1000. Only links withlinkScore > 600are shown in these tablescorr: Pearson's correlation between the region and the genecorrDir: Whether the region-gene correlation is positive or negative or not significant (n.s.)G3_weight: GENIE3 (random forest) weight for the region to that gene (i.e. all nearby regions are used to “predict” the gene's expression)G3_rankBinQ: Rank of the GENIE3 weight after binarizationwithinBeaf: Whether the link is in a BEAF-32 domains (i.e. between two BEAF-32 peaks)
Download tables:
- [Positive links - Predefined regulatory regions]
- [Positive links - Peaks]
- [Non-positive links - Predefined regulatory regions]
- [Non-positive links - Peaks]
Network version: 1.0 (Aug. 2021); Table last updated on July 2020.
RNA markers
[+] Description
Gene expression in adult cell types (markers and gene detection). Only contains the cell types matched to ATAC.
Markers: Adult cell type markers
Columns:
Cluster: Cluster/cell type nameisTF: Whether the gene is annotated as transcription factorpct.diff: Difference in percentage detection between the given cluster and the rest of cellsGene,p_val_adj(adjusted p-value),avg_logFC(average fold change),pct.1,pct.2(percentage of detection in the cluster and remaining cells): Values calculated with Seurat for the given Gene and Cell type
Genes detected: Genes detected in cell types (RNA).
Columns:
cellTypeandgeneperc: Percentage of total cells in the cluster with expression bigger than 0.cnt: Number of cells in the cluster with expression bigger than 0.
Network version: 1.0 (Aug. 2021); Table last updated on Feb. 2020.
Enhancer architecture explored through Deep learning
Select an enhancer to view the nucleotide importance prediction based on DeepFlyBrain:
[+] Description
The enhancers in the networks (eGRNs) were scored with DeepFlyBrain (the Deep Learning model trained on 15 selected adult cell types with 81 topics).
Since DeepFlyBrain requires 500 bp regions as input, each ehnancer is scored using 500 bp sliding windows with 50bp shift, and keeping the subregion with the highest prediction score for the cell type-specific topic. This prediction score is also assigned to the enhancer, and visualized in the eGRNs as region border width ('DL_score').
Top plot: The height of each nucleotide represents the importance of the nucleotide for the prediction on the given topic. Positive nucleotide importance predicts a region to be open, while negative importance indicates repression of accessibility. These importance are obtained scoring the 500bp region with DeepExplainer.
Bottom plot: Deep learning prediction score of the region on each topic.
i.e. For the Astrocyte-like enhancer “chr2L:10056497-10057697”, the sub-region “chr2L:10056628-10057128” was selected.
Last updated: 5 Aug 2020
[+] Legend: Topic - Cell Type correspondence
01 - Pan-neuron
03 - BEAF-32, Pan-glia
08 - Pan-neuron
09 - BEAF-32
10 - T3
18 - T4
20 - T2
21 - Alpha/Beta Kenyon cells
22 - Chiasm glia
23 - T1
25 - Cortex glia
32 - T4/T5
34 - Perineurial glia
35 - Gamma Kenyon cells
36 - Subperineurial glia
40 - Pan-glia
43 - BEAF-32
44 - T2a
56 - Ensheathing glia
59 - Pan-glia
60 - Pan-neuron
65 - Pan-neuron
68 - Astrocyte-like
72 - Ensheathing glia (partly)
77 - Alpha'/Beta' Kenyon cells
Other topics: not annotated
See also: Extended Data Fig. 10 in the paper (pre-print available in Biorxiv)
Download summary of all TF patterns accross cell types.
Enhancers overlapping janelia lines
[+] Description
Overlap of accessible chromatin regions with enhancer-reporter lines available in Janelia's Flylight and ViennaTiles resources.
Columns:
Line: Line ID in the source database (Janelia's Flylight / ViennaTiles)LineLocation: Coordinates of the region cloned in the Janelia/VT linebrainPeaks: Overlapping accessible peaks in brain (consensus across all cell types)nPeaks: Number of overlapping peaksDAR_in: Cell types in which the region includes (or is included) in a Differentially Accessible Region (DAR) (e.g. non-ubiquitous peaks)nCellTypes: Number of cell types in which the line overlaps a Differentially Accessible RegionLineType: Source database (Janelia's Flylight / ViennaTiles)
Last updated: 5 Aug 2021
Summary of statistics
Regulatory regions:
Consensus peaks across ages (i.e. includes brain + VNC): 95,921 (500bp) and 207,325 (150bp) peaks, covering aprox. 39% of the genome. (Note that these peaks use a very lenient peak calling to include potential enhancers from small cell populations).
Peaks for adult cell types (with more stringent threshold): 60,210 disjoint peaks of an average width of 455 bp, covering 19% of the genome.
Cell type specific accessibility: - Coming soon
See also: Extended Data Fig. 3 in the paper, for the number of DARs per cell type.
Peaks across development: - Coming soon
See also: Extended Data Fig. 3 in the paper.
Adult cell types in late pupa: - Coming soon
Overlap with Janelia regions:
- 220 Janelia lines do not overlap with any of the 95k peaks in our dataset (adult+devel), 685 overlap with only one peak, and 2551 with more than one.
See also: Tab “Janelia” in “Enhancer Architecture”.
Regulatory domains (i.e. search space for enhancer-gene links):
Genomic regulatory blocks (GRB): Median GRB size: 127.6kbp; Number of genes in GRBs: 1438 (15% of the 9513 genes with links); Median percentage of links per gene in the same GRB: 100% (average: 80%)
Topologically associated domains (TAD): Median TAD size: 13.1k (IQR: 7355-28095), Number of genes with their TSS in TADs: 8620 (90% of the 9513 genes with links); Number of genes with their biggest transcript within one TAD: 6410 (67% of 9513); Median percentage of links within TADs (regulatory region and TSS in the same TAD): 14% (average: 26%)
BEAF-32-defined domains: Median BEAF-32 domain size: 57.7k (median distance between two of the 2878 BEAF-32 peaks with motif: 5296bp, IQR: 23089–105978); 88% of genes are between two BEAF-32 Chip-seq peaks within 200kbp (46% within 50kbp; 86% of genes are within 50kb of a BEAF-32).
Median distance from GRB to closest BEAF-32 peak: 14.9k upstream, 21.3k downstream. 58% of the GRBs do not include any BEAF-32 peak (and only 19% include more than 1 peak).
See also: Extended Data Fig. 14 in the paper.
Region-gene links:
Within **100kbp* of the gene (from 50kbp upstream to 50kbp downstream, including introns; ignoring other types of boundaries/domains)*
Median number of links per gene (disjoint regions): 6 positive (IQR: 3-11), 3 negative (IQR: 1-5). Most regions are linked to max. 1 gene.
Of these, a median of 56% (6 links) are within its BEAF-32 domain; with a median distance between the center of the region and the TSS is 23kbp (IQR: 5-33kbp).
About a 14% of the linked regions are promoters (TSS-500bp), this percentage remains similar between DARs, cistromes and eGRNs:
- 13% of regions in the eGRN are in a promoter* of the gene they regulate, 43% within the longest transcript, and the rest distal (up to 50kbp from the gene). (8% if only the most upstream promoter per gene).
- 14% of regions in cistromes are in the promoter of a gene (not necessarily linked), and 67% within a transcript.
- 14% of DARs are in the promoter of a gene, and 69% within a transcript.
(*) The categories are not exclusive. i.e., if a TSS is within the transcript of the longest isoform, it is counted twice. Also, for cistromes and DARs a region can be in the promoter of a gene, and transcript of another…
Cistromes:
- 116 TFs have “chromatin-opening” cistromes (positive correlation between TF expression and motif enrichment) with at least 10 target regions. In addition, 63 TFs are also expressed in cell types which present enrichment of their binding motif, but not necessarily with strong correlation (i.e. the TF activity might be regulated at post-transcriptional levels). Of the 116 TFs, 60-80 are neuron-type specific, 10 TFs show pan-neuronal activity across central brain and optic lobe, and 22 are mostly glial.
- 131 TFs present negative correlation between the TF expression and motif enrichment (i.e. these include candidate represors for closing the chromatin).
- 51% of cistrome regions are linked to a target gene, while 19% are retained in the eGRNs. Most of the regions in cistromes are located within 50kbp of expressed or marker genes of the corresponding cell type (76-95%), indicating that our linking method is likely conservative –rather than non-linked regions being orphan enhancers (e.g., without target gene)–.
See also: Extended Data Fig. 8 in the paper, for an overview of the cistromes.
Gene-regulatory networks (eGRNs) - Stats for activator TFs:
87 TFs in eGRNs (80 with at least 10 target genes in a cell type), with 4972 enhancers linked to 2023 genes (13% of these linked regions are promoters, 43% intronic, and the remaining more distal). These cover 17% of the adult DARs, and 39% of the marker genes.
Regulators per gene (across all cell types): an average of 5 TFs and 3 regions regulate each gene (regions IQR: 1-4, range: 1-55; 62% of the genes are regulated by several regions).
Targets per TF: 61 genes (IQR: 31-132), 84 regions (IQR: 35-204). 31/80 TFs are auto-regulatory.
Cell type specific eGRNs: Each cell type has a median of 5 TFs (range: 1 to 15) collectively regulating 65 target genes (range: 21-788) through 106 enhancers (range: 19-1171).
Regulators per gene (within a cell type): most genes are regulated by 1-2 regions (40% of the genes are regulated by several regions). 63% of the genes are regulated by several TFs within the cell type, 93% of them have an enhancer with several TFs.
List of resources
This page contains the list of files available for download
scATAC-seq raw data (fastq files) can be downloaded from GEO (GSE163697), which also includes bigwig, and cisTopic objects.
Pre-processed data per run (output from Cell Ranger), including:
CellRanger report (web_summary.html)
Fragments files (fragments.tsv.gz)
Cell QC stats (singlecell.csv; barcodes with value in the column “cell_id” are considered cells)
Accessibility and expression matrices:
[+] File format:
The loom files contains both, the matrix and the cell annotation. Most of the files are also available for exploration and download in SCope..loom and cisTopic
To access the data you can use the R and Python packages. i.e.
# R code:
library(SCopeLoomR)
loom <- open_loom("AdultP72.loom")
atacMat <- get_dgem(loom)
cisTopic objects can be used to obtain the region accessibility probability (the raw counts are common to all subsets, so they are not included). The objects also include cell and region annotation, etc… These files can be loaded in R through cistopic:
cto <- readRDS("AdultP72_cisTopic.Rds")
library(cisTopic)
# use cisTopic normally, e.g.:
plot(cto@dr$cell[[1]])
predMat <- predictiveDistribution(cto)
scRNA-seq count matrices and analisys results:
- Adult: Davie_Janssens_Koldere_et_al_2018_AdultBrain.loom (118687 cells, 11652 genes; 495 MB)
- Larva: Ravenscroft_et_al_2019_LarvalBrain.loom (5056 cells, 9853 genes; 20 MB)
scATAC-seq
- Count matrix (cntMat_scATAC_240919c_129078r.mtx.gz) (240919 cells, 129078 regions; 2255 MB);
- Count matrix cells (scATACcells_cntMatRows.txt.gz)
- Count matrix regions (scATACregions_cntMatCols.txt.gz)
- Cell info (scATAC_cellData_240919c.tsv.gz)
- Adult + 72APF: cisTopic probabilities (AdultP72.loom) (31k cells, 57,190 regions; 838 MB); cisTopicObject (AdultP72_cisTopic.Rds) (60,624 cells, 128,927 regions; 127 MB);
- Adult + 72APF + 48 APF: cisTopic probabilities (AdultP72P48.loom) (88,331 cells, 37,934 regions; 1.8 GB)
- Larva to 12h APF: cisTopic probabilities (L3P12.loom) (XX cells, XX regions; 2 GB); cisTopicObject (L3P12_cisTopic.Rds) (135,275 cells, 129,027 regions; 233 MB)
- All time points: cisTopic probabilities (All_timepoints.loom) (150,000 cells, 32,305 ctx regions; 2.5 GB); cisTopicObject (AllTimepoints_cisTopic.Rds) (240,919 cells, 129,078 regions; 476 MB);
Cell-type aggregated files, peaks, and enhancer-gene links (also available for exploration in UCSC Genome browser):
Cell type aggregates:
- Adult cells: bigwig/AdultCellTypes/ (bigWig/.bw)
- Early development (Larva - 12APF): bigwig/EarlyDevelCellTypes/(bigWig/.bw)
Links enhancer to gene:
- Positive (predefined regulatory regions): region2geneLinks_pos_ctx.bb
- Positive (peaks): region2geneLinks_pos_peaks.bb
- Negative (predefined regulatory regions): region2geneLinks_nonPos_ctx.bb
- Negative (peaks): region2geneLinks_nonPos_peaks.bb
Peaks:
- Adult whole-brain aggregate: BrainPeaks_ResizedToMax500.bed (Regions used for the lvl2 analyses and deep learning)
- Adult cell types: peaks/AdultCellTypes/ (.bed)
- Early development cell types(Larva - 12APF): peaks/EarlyDevelCellTypes/ (.bed)
Other regions:
- Regulatory regions: ctxRegions.bed (used in cisTopic analyses; source: i-cisTarget)
- Enhancers tested: enhancersTested.bed
- BEAF-32 ChIP-seq peaks with motif: BEAF32chip_peaksWmotif.bed
Regulatory networks (cistromes and eGRNs):
[+] File format:
The feather files can be read in Python directly through Pandas (e.g. .feather pandas.read_feather), and in R with arrow::read_feather("filename.feather", mmap=T).
Adult cell types: cistromes_eGRNs_Adult.feather
Other analysis results - data matrices available in the networks section:
DARs (Differentially accessible regions for each cell type)
List of cell types and colors used in the plots: cellTypeInfo.tsv
Other analysis results - Deep learning:
Overview of all TF patterns accross cell types(TFmodisco, .pdf)
DeepFlyBrain (DL models, available in Kipoi)
Help & Tutorials
A few examples of queries that can be carried on this website:
-Under construction-
Video abstract
The paper is currently under review. Once we have a final version, we will include a video abstract.
Meanwhile, you can see the pre-print in BioRxiv, and a temporary video presentation here:
Note: the data in the website has been updated during the revision. The networks in the pre-print and presentation are now outdated.